Mechanisms of evolution
The paper: Leiby, N. and Marx, C.J. (2014) Metabolic Erosion Primarily Through Mutation Accumulation, and Not Tradeoffs, Drives Limited Evolution of Substrate Specificity in Escherichia coli. PLOS Biology. doi: 10.1371/journal.pbio.1001789
Subject areas: evolution, biochemistry
Vocabulary:
catabolism – the systematic breakdown of large or complex molecules into smaller components along with a release of energy that can be used by the cell. Catabolism and anabolism (production of macromolecules from small molecules) together are the metabolism of the cell or organism.
—–
This article is a summary of a recent primary research paper intended for high school teachers to add to their general knowledge of current biology, or to supplement their lessons by showing students the kinds of projects that current biological research addresses.
—–
In organisms like humans, or even mice, it can be difficult to study the effects of evolution because evolutionary changes take many generations to appear, and for us humans, a new generation takes over a decade, often longer. Furthermore, in complex organisms, many changes can be difficult to spot and follow over time. Enter the lowly bacteria, Escherichia coli, which reproduces very quickly, and has a small genome in which to watch for mutations. Since February of 1988, Richard Lenski and his colleagues have kept up a long term evolution experiment (LTEE), which has propagated a bacterial culture every day for over 50,000 generations. Every 500 generations (75 days), samples are taken and frozen so that researchers in the future can go back in time to determine when a particular trait may have arisen, changed, or disappeared.
In today’s paper, Leiby and Marx used samples from the Lenski LTEE to investigate the mechanism by which evolutionary adaptation arises. In particular, they wanted to see how the bacteria’s ability to use different carbon sources as food changed over time, and how those changes came about. The LTEE bacteria are normally grown in a medium that provides only glucose as a carbon source. Over 20000 generations, it had been found that competitive fitness of the E. coli on glucose had improved by 70%. At the time, assays for fitness on other carbon sources was carried out on Biolog plates that had an array of 95 different carbon sources and an indicator dye that showed how much bacterial growth there was on each. Based on these assays (Cooper and Lenski, 2000) there appeared to be significant drops in the ability to use other carbon sources.
These negative changes to non-glucose metabolism seemed to coincide with the positive changes in glucose metabolism, and supported a mechanism of antagonistic pleiotropy – basically the idea that mutations that are good in the current environment had “side effects” or tradeoffs, that are bad in other environments. This is quite different from an alternate mechanism that can produce increased fitness in one environment – an accumulation of mutations that are helpful or beneficial in the current environment, but have little effect in other environments, positive or negative.
Leiby and Cox noticed that using the Biolog plates with the carbon sources stuck to the bottom sometimes gave different results from assays in which the carbon source is well-mixed into the liquid media. The noted that the LTEE bacteria are normally grown in 10 ml liquid cultures in a shaking incubator, where they are vigorously shaken, not only dispersing nutrients, but also aerating the culture. In contrast, Biolog experiments are done on non-shaking shallow plastic plates about 5 x 3 inches, divided into 96 microwells that hold about 300 microliters. Therefore, they decided to look at the glucose specialization of some strains of the LTEE E. coli, and how metabolism of other carbon sources is affected. [Note to students: In hindsight, it might seem obvious that the experimental conditions should be much more similar to the growth conditions, but in real-life laboratory practice, that is not always practical, and for efficiently assaying many strains of bacteria on many different carbon sources, the plates seemed to be a good model at the time.]
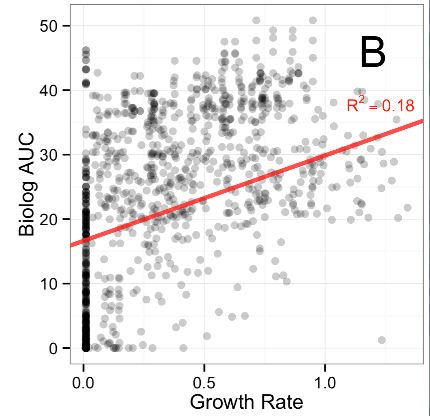 The first figure of the paper demonstrates that respiration rates, as measured by the Biolog plates, are not a good indicator of growth rates. If they were, the dots would be more clustered around a diagonal line. Respiration rate is just the amount of “food” or carbon source material converted into useful cell stuff and waste products. In theory, it should be roughly proportional to growth rate. However, because it is not the case here, and since it is the growth rate improvement that confers an evolutionary advantage, it would be better to measure that directly on the various carbon sources.
Figure 2 shows the result of growing strains from the 20000th (block A) and 50000th (block B) generations of the LTEE, on a variety of different carbon sources. To make sense of this, the red-toned blocks indicate higher relative growth rates than the ancestral E. coli strain, with the darkest blocks being the highest growth rates, and the blue-toned blocks indicate lower relative growth rates, with the darkest blue blocks being the lowest growth rates. The “x” indicates no growth during the 48 hour observation period. The y-axis lists the different carbon sources that the bacteria were grown with, and the various strains are listed on the x-axis. Finally, some of the strains are labeled “mutators” because they have a ~100x higher mutation rate.
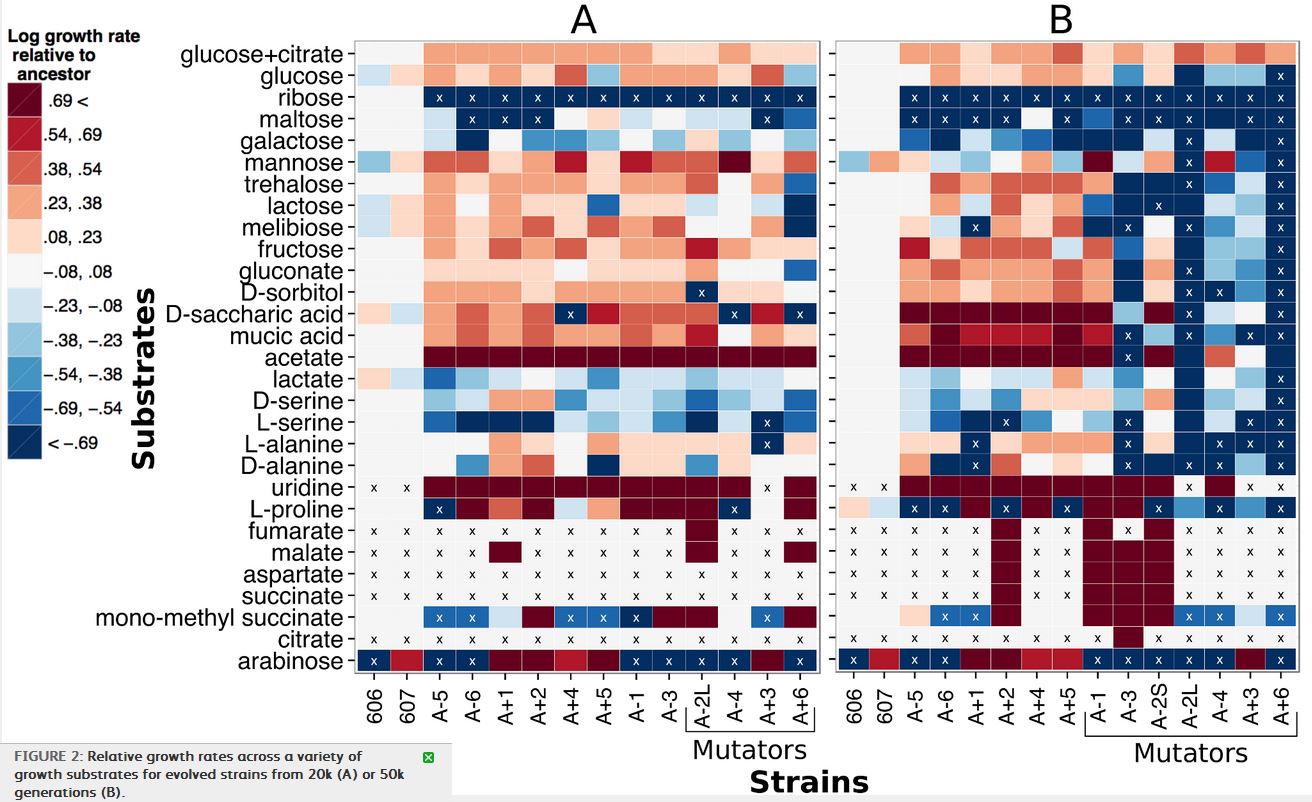
So what can we learn from this array of colored blocks? First, there are clearly strains that have acquired gain-of-function mutations. In 2008, acquisition of citrate metabolism was described, but others, such as malate or succinate, have not been. There are, also a number of strains that have a lowered ability to metabolize some carbon sources. Keep in mind here, that these gains and losses came about in strains that were not evolving on those specific carbon sources: they were evolving them while growing on glucose.
Interestingly, while mutator strains were only marginally worse (meaning decreasing growth rate) than non-mutator strains at 20000 generations, by 50000 generations, there are significantly more growth rate decreases (blue boxes on the right side of panel B) in the mutator strains than the non-mutators. Conversely, nonmutator strains at both 20k and 50k generations had more increases in growth rate than mutators, and again the difference was greater after 50k than at 20k. It seems that as mutation rate increases over the generations, the mutations become more negative in their effect on growth rate on non-glucose carbon sources. The authors suggest this may be due to accumulation of mutations leading to gradual degradation of proteins that are not needed for glucose metabolism, as opposed to the possibility that mutations causing increases in efficiency on glucose also have a negative tradeoff on other substrates.
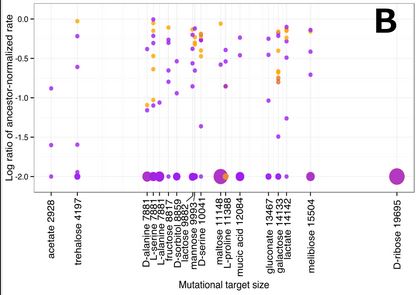 The investigators also looked into the possibility that the magnitude of changes in growth rate on alternative carbon sources had something to do with a similarity of the catabolic pathway (sequence of enzyme-mediated chemical breakdowns)of those carbon sources to the glucose pathway. This could be the case if dissimilar carbon sources had breakdown pathways that included more unique enzymes not used in glucose catabolism. If they have more targets for mutations that could disrupt the pathway for growth on those carbon sources without affecting growth on glucose, their normal environment, then there should be a more mutations leading to a drop in growth rate. However, what they found is that there is no correlation between the number of possible mutations (mutational target size) and a reduction in growth rate.
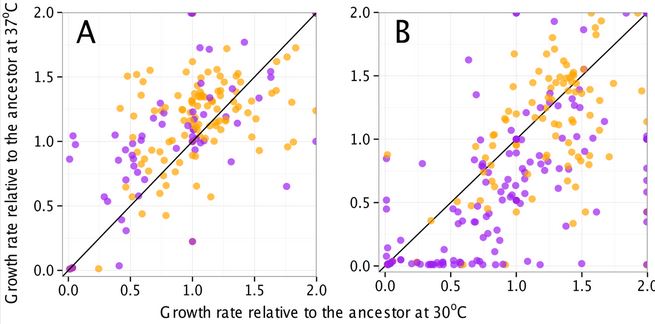 However, there was an unexpected correlation that came out of the study: mutator strain growth is significantly more sensitive to temperature than nonmutator strains. In this figure, purple dots are mutator strains, panel A shows the different strains at 20000 generations, and panel B shows the strains at 50000 generations. This seems to suggest that many of the mutations cause destabilization of certain catabolic enzymes, and the lower temperature helps stabilize them, while the higher temperature further destabilizes them.
No comments
Be the first one to leave a comment.